
Appearance
Statistics
Statistics shows how your marketing is doing across the whole workspace: emails, campaigns, contacts, pipeline and texts. You can also run reports, and have them emailed to you on a schedule.
Owners and admins
Statistics is in the menu for owners and admins.
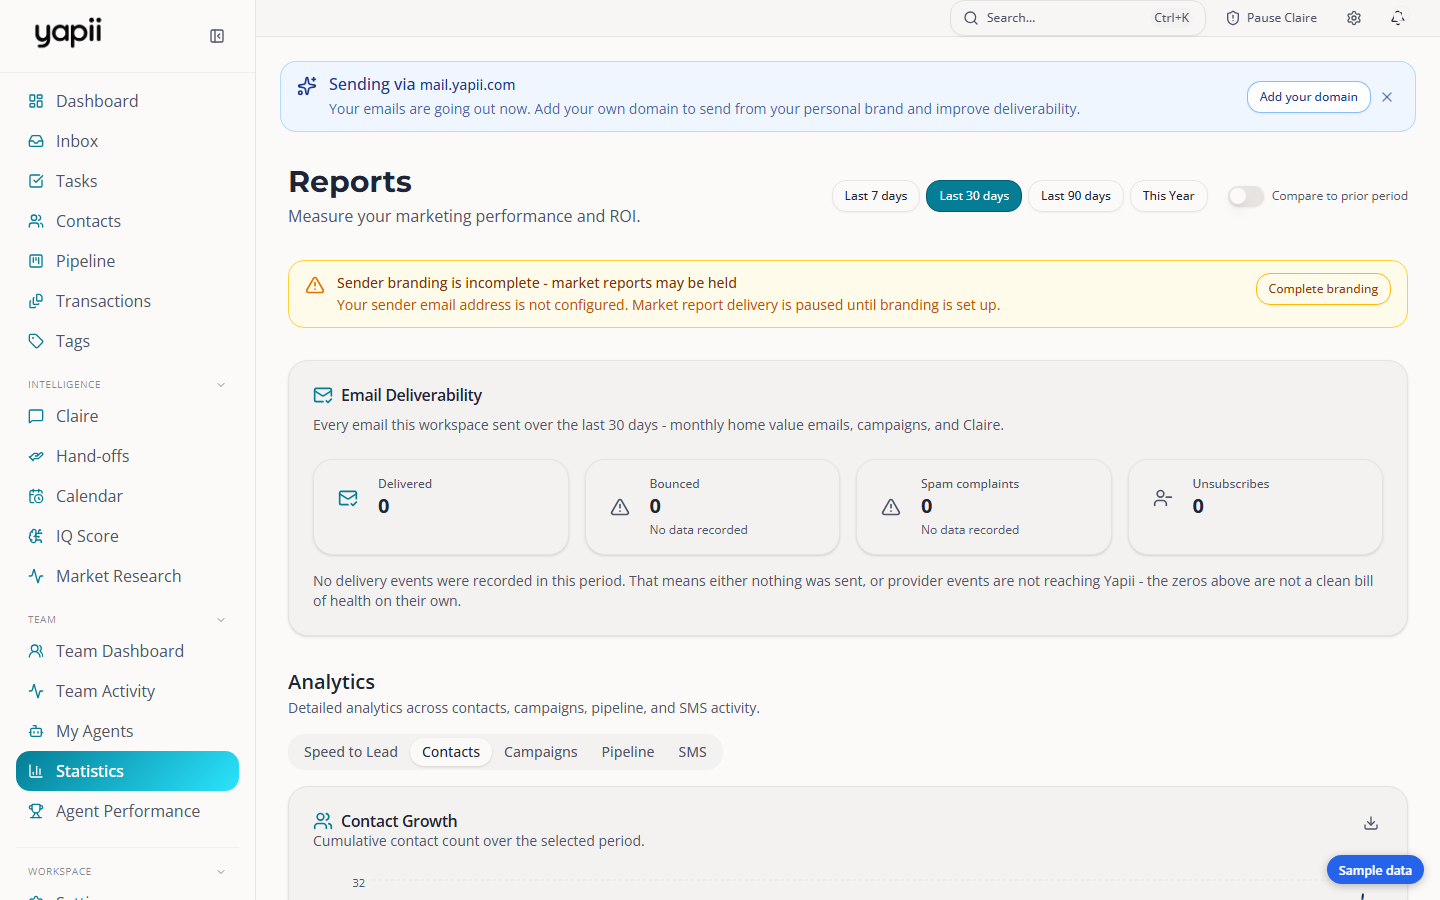
Open Statistics from the left menu, under Team. The page itself is titled Reports.
Choosing a period
Use the buttons at the top: Last 7 days, Last 30 days, Last 90 days or This Year. Turn on Compare to prior period to see the change against the period before.
What's on the page
- Email Deliverability: how well your emails are getting through.
- Analytics: tabs for Speed to Lead, Contacts, Campaigns, Pipeline and SMS.
- Business Intelligence Reports: ready-made reports you can run or schedule (see below).
- Monthly Broker Reports: reports Yapii creates at the start of each month, with a PDF to download.
- Seller Monthly Emails: how the monthly home value email is doing.
- Engagement Over Time, Channel Breakdown, Top Performing Segment, Contacts by Source and Top Campaigns. Several of these have a download icon for a spreadsheet (CSV) file.
Running a report
- Under Business Intelligence Reports, pick a Report period.
- Click Run Report on the report you want.
- Find it under Report History and click View. You can download it as a CSV file or open it in Google Sheets.
Getting a report by email
- Click the calendar icon on a report.
- Choose Weekly (Mondays) or Monthly (the 1st of the month), and add who should get it.
- Click Schedule Report.
Your schedules are listed under Scheduled Deliveries. Click the bin icon to stop one.
Good to know
- Top Performing Segment needs a segment that at least 50 people received.
- If you see a note that your sender branding is incomplete, click Complete branding. Until you do, market reports may be held back.